Sportech : AI supported Ice Hockey Analytics
- Jul 6, 2025
- 11 min read
Updated: Apr 8
How I redesigned an ice hockey analytics platform into an AI-powered coaching system, unifying a web tool for coaches and a mobile app for players on the road

Timestamp: 2024-25 | 6 month
My role
As Product Designer and UX Researcher, I led the redesign of 49ing's AI-enhanced analytics system over a 6-month engagement. The work spanned both the player-facing mobile app and the coach-focused web platform. I collaborated closely with the product manager, a senior frontend engineer, and the founder (a former coach), aligning UX, AI functionality, and platform strategy across both environments.
Phased Timeline & Scope
Month 1–2: Discovery & Mobile Redesign for Product Day
Conducted in-depth domain research into hockey analytics.
Ran a UX audit of the existing app.
Interviewed players (ages 13+) to understand stat comprehension, app usage habits (esp. pre/post game), and motivational triggers.
Defined mobile IA and revised navigation to reflect real-time use cases (e.g., checking stats on the bus).
Co-developed light branding and design principles via weekly dialogues with the PM and IT manager to celebrate the significant value proposition evolution toward 'Hockey AI'
Conceptualized the "Hockey AI" as a contextual, conversational layer to help players understand their personal stats. Initially scoped for future release.
Deliverables:
Redesigned mobile app in time for Product Day, with foundational IA and updated UI.
Advised on implementing "Hockey AI" as a conversation layer within the existing platform.
Integrated the mobile AI Coach at a limited scope (player-only, not full app), used primarily to clarify stats.
Themed dark mode and simplified flows enhanced usage in variable lighting conditions (e.g., on the road).
Post Product Day Feedback:
Users praised improved stat clarity and easier navigation.
AI Coach was especially appreciated for demystifying advanced metrics.
Players better understood subscription-based visibility constraints (what info was/wasn't accessible).
Month 3–6: Full Platform Revamp & AI Expansion
Shifted to web platform: discovery, UX audit, competitor analysis.
Developed personas for coaches (validation-driven, explorers, hunch-led skeptics)
Mapped journeys for pre-game briefings and post-game debriefings.
Reframed the AI Coach experience for coaches, from chat UI to context-aware stat narratives.
Redesigned the information architecture to unify fragmented views (e.g., 5v5, 5v4 tabs replaced with filters).
Created low- and high-fidelity mockups for new web dashboards, drill planners, and video-stat sync.
Problem

As AI reshapes sports analytics, 49ing’s web app for coaches and mobile app for players have become fragmented from ad hoc growth. A full redesign was needed to deliver clear, role-specific insights without overwhelming users.
Both the platform and mobile app had become fragmented and hard to navigate, scattering data, video, and insights. The plan to incorporate AI added complexity: it had to support, not replace, human expertise. I was responsible for designing an AI experience that met 49ing’s benchmark, professional, trustworthy analytics while building confidence for both coaches and players.
Process

I model my process on the Double Diamond, balancing discovery with delivery. I guide stakeholders through ambiguity (problem finding) before entering solution mode. This ensures we’re solving the right problem, at the right fidelity, for the right users.
Diamond one: finding the right problem to solve - A

Competitor Analysis:
Searching for competing models in video assisted analysis for Ice Hockey

User Interviews
Conducted with both players (ages 13+) and coaches to identify their goals, frustrations, and mental models.
Key Findings
Players use the app in time-limited, variable-light contexts (like on buses): they need clarity, speed, and simplicity.
Players need clarity and confidence, not just data dumps.
Coaches needed holistic, comparative analytics and easy video tagging.
Coaches need transparency, control, and seamless navigation across video and metrics.
Both groups struggles with the fragmented presentation of stats and videos. These fragmented tools fail to align with real-world time constraints and mental models.
Players
Players (ages 13+) shared routines of reviewing stats on the bus before and after games.
They wanted quick, personalized feedback and highlight videos, and found the existing interface too cluttered and confusing.
From Swiss hockey forums, a common player sentiment emerged:
“Checking stats on my phone after the game feels like chore when I just want to see my highlights." U17 forward, Zurich
“I check my stats after the game on the bus, but I usually give up, it’s hard to find what I’m looking for.” U17 forward, Zurich
“It’s cool to see my shots and goals, but I wish it just told me what I did well, not all the numbers.” Junior player, Lausanne
This affirmed players' need for faster, more accessible interactions, with data contextualized and explained.
Coaches
7 coaches were interviewed, across a mix of generalist coaches and specialized video/data coaches.
“I don’t need more data, I need the right data, at the right time, in the right view.” U20 coach, Bern
“I tag videos manually every week. If AI can help but still let me control it, I’ll take it.” Video analyst, Geneva
“Real-time analytics are useless if they don’t match what I see on the ice. I want something that helps me validate my gut.” Coach-manager, Lugano
Goals & Frustrations:
Coaches sought holistic, comparative analytics and an easier video-tagging workflow.
The fragmented presentation of stats and videos across multiple tabs created friction in preparing practices, delivering insights, and reviewing games.
Diamond one: finding the right problem to solve - B

Mobile UX Audit & Expert Review
The first iteration included an onboarding session, which allowed me to understand the importance and role of statistics for young players on the road, as well as a lean UX audit of the current platform.


UX Audit & Expert Review
The assignment evolved from a successful revamp of the mobile app, along with a lean branding suite based on Gen AI tools, into a comprehensive redesign of the web platform that matched the new branding and mobile app UI. I analyzed user flows, navigation pain points, and interaction inconsistencies.


Key Insights
Coaches work across multiple sections and need unified, streamlined video-stats workflows. All could benefit from contextual AI support.
The workflow is cumbersome and hindered by the excessive fragmentation: disjointed tabs, hidden functions, and no seamless data-to-video linking.
Persona & Journey Mapping
Developed personas for players, coaches, and parents, mapping their journeys and touchpoints with the platform. See JBTD
Mental Model
Coaches varied in their orientation toward data:
Some used it to validate existing strategies.
Others wanted to discover new trends.
A few were skeptical and used analytics to support statements rather than drive decisions.
Coach Persona Segmentation
Coaches fall into three distinct categories based on their approach to data:
Validation-Driven Coaches - use analytics to confirm their instincts.
Explorers - are curious and look to discover new patterns in the data.
Hunch-Led Skeptics - rely on gut feelings and use data mostly to support pre-formed opinions, rather than challenge or refine them.
All coach types face common UX challenges:
Excessive time spent annotating videos manually.
Rigid workflows and templating burdens.
Data skepticism, particularly about real-time insights, which are perceived as delayed or hard to act on.
Problem Framing
The core problem was not just "show more data," but "make complex analytics actionable and digestible for each persona, at the right moment." We arrived at this understanding based on the realization that the video is the main tool to source insights, communicate plans and boost improvements.
Diamond two: finding the right solution - A

Develop: Explore potential solutions
Searching for inspiration:
Searching for competing models in video-assisted analysis in general, for practical inspiration.

JBTD - Before the AI Coach
See next: how I transformed the JBTD into a UX strategy framework.
1. Head Coach
“When preparing for a game or evaluating team performance, I need to review game footage and stats manually so I can adjust strategies, plan drills, and communicate tactical changes to my team.”Pain Points:
Tedious video review
Disconnected stats and clips
Lack of time for deep analysis
2. Assistant Coach
“When supporting the head coach or focusing on specific units (e.g., power play, defense), I need to analyze performance sequences manually to prepare drills and give focused feedback.”Pain Points:
Fragmented data sources
Manual drill planning
Delays in feedback loops
3. Video Coach
“When reviewing or preparing game footage, I need to manually tag key moments and organize clips to provide coaches with actionable visual breakdowns.”Pain Points:
Time-consuming tagging
Inconsistent annotation methods
Inefficient sharing workflows
4. General Manager / Team Manager
“When managing the roster or scouting players, I need to compare performance data across games and seasons to support recruitment and development decisions.”
Pain Points:
Limited access to reliable, recent data
No unified view of team vs. individual KPIs
Time-intensive cross-referencing
5. Player (Age 13+, aspiring pro)
The information exists, but it’s not clearly accessible, visible, or understood.
Players struggle to gain value from the platform because:
Personal performance insights are buried or presented in a non-intuitive way
There’s no clear feedback loop connecting games, practices, and progress
Peer benchmarks exist, but aren’t surfaced in a relatable or motivating context
6. Parent
“When supporting my child’s hockey journey, I rely on word-of-mouth or brief coach updates to understand how they’re doing and where they can grow.”Pain Points:
Limited visibility into progress
No context for comparison
Passive role in development
7. Referee / Official
“When building a competitive roster, I need to evaluate player performance over time so I can make informed recruitment decisions, identify underperformers, and plan for potential player replacements.”
Evaluate individual player performance over time to inform recruitment decisions
Compare players across roles, games, and seasons to build a balanced roster
Identify underperforming players to plan replacements or training investments
Monitor team depth and potential skill gaps for strategic planning
Make roster decisions based on observed patterns rather than fragmented impressions
Track long-term player development without a centralized, consistent view
Diamond two: finding the right solution

Converging on a solution
The solution was threefold: First, I overhauled the information architecture, replacing the fragmented system with a coherent structure tailored to each persona’s workflow. Second, I designed the AI Coach, embedded into both web and mobile: on the platform, it offered coaches tailored explanations and performance-boosting recommendations without compromising their autonomy; on mobile, it befriended stats through a conversational interface for younger players. Third, I introduced interactive information visualizations to spark curiosity and empower staff to uncover deeper insights.
JBTD - Enhanced by the AI Coach
Identifying key UX areas of improvement, defining the AI value proposition, and turning it into a UX strategy outline
1. Head Coach
UX Areas for Improvement:
Video review is time-consuming and lacks contextual overlays.
Performance trends are hard to spot without manually comparing games.
No real-time visibility into team or individual tactical errors.
AI-Enhanced Assumed Value: Real-time video tagging and contextual insights can reduce prep time and surface patterns instantly, empowering faster, smarter coaching.
2. Assistant Coach
UX Areas for Improvement:
Drill planning is manual and detached from real performance data.
Performance feedback to players is delayed or anecdotal.
Managing unit-specific (e.g., defense, special teams) workflows is fragmented.
AI-Enhanced Assumed Value: AI drill suggestions based on performance data and instant access to tagged sequences streamline preparation and decision-making.
3. Video Coach
UX Areas for Improvement:
Manual tagging is repetitive, error-prone, and consumes significant time.
Tools for creating and sharing video clips are not well integrated.
Lack of automation creates bottlenecks in pre- and post-game workflows.
AI-Enhanced Assumed Value: Automated tagging and side-by-side clip sharing might save time and ensure consistency, enabling faster team debriefs and prep.
4. General Manager / Team Manager
UX Areas for Improvement:
Difficult to get a high-level view of team and player performance across games.
No intuitive tools for comparing players, setting KPIs, or spotting trade/recruitment opportunities.
Workflow friction when toggling between individual and team-level stats.
AI-Enhanced Assumed Value: Smart dashboards and comparative metrics can provide a clear, high-level view for decision-making at a glance.
5. Player (Age 13+, aspiring pro)
UX Areas for Improvement:
Players struggle to access or interpret their own data.
There’s no intuitive feedback loop that connects practice, game performance, and progress.
Peer comparison is either missing or not motivating.
AI-Enhanced Assumed Value: Simplified visualizations, player-to-player comparisons, and narrative stat summaries help players understand their progress, build confidence, and take action.
6. Parent
UX Areas for Improvement:
Parents rely on coach feedback or word-of-mouth to gauge their child’s development.
There’s no accessible benchmark to understand how their child is progressing over time or against peers.
Platform is not designed with parental observers in mind.
AI-Enhanced Assumed Value: Transparent, digestible stats help parents support and encourage their child’s growth with meaningful context.
7. Referee / Official
UX Areas for Improvement:
Scouting requires jumping between multiple data sources and video archives.
There’s no unified interface for comparing players across different games, roles, or seasons.
Predicting when to replace or develop players relies on subjective judgment and sparse long-term trends.
UX strategy
Based on cross-functional workshops, we aggregated and prioritized the areas of improvement:
Mobile (Players & Parents)
UX Opportunities:
Players struggle to understand their performance trends and progress over time.
No meaningful peer comparison tools to motivate player development.
Performance data is challenging to contextualize; users can’t see what is actionable at a glance.
Parents lack simple, digestible views to track their child’s development.
Feedback loops are delayed, and players often receive insights too late to act on them.
AI-Assisted Improvements:
Personalized, digestible summaries help players and parents understand development.
Conversation-based interfaces enable younger users to engage with their data more intuitively.
Real-time pattern recognition surfaces immediate insights from games.
Smart prompts connect game stats with next steps for improvement.
Peer benchmarking provides motivational, role-specific comparisons within a positive framework.
Platform (Coaches, Managers, Video Coaches)
UX Opportunities:
Navigating fragmented video archives and stats across tools slows down workflows.
Manual tagging and analysis of footage is repetitive and inconsistent.
Lack of unified views for comparing individuals across roles, games, or time periods.
Drill planning and session preparation are disconnected from real performance data.
Sharing and collaboration between staff is disjointed, with limited cross-role visibility.
AI-Assisted Improvements:
Automated tagging reduces manual effort and accelerates video review.
AI-powered dashboards simplify comparison across players, roles, and time frames.
AI drill suggestions connect performance data to training decisions instantly.
Smart prompts guide coaches to weak areas and offer strategic adjustments.
Predictive insights uncover trends not visible through traditional stats alone.
Information Architecture Redesign:
Replaced fragmented tabs (5v5, 5v4, 4v5) with unified dashboards showing trends, context, and comparisons across situations and timeframes.
Shifting from feature focus to user-centered design
Based on the previous double diamond phases, it was clear that the cluttered interface strained usage, enhancing cognitive burden and slowing users' adoption. Turning the focus on user needs and harnessing the AI coach's assistive capabilities opened a way to boost, empower, and influence actual coach day-to-day processes, aligning with the founder's vision of empowering through Ice Hockey analytics.
Reimagining the platform
Created low-fidelity flows in Figma, iterated based on feedback.
Developed high-fidelity mockups in Figma, focusing on:
Consistent navigation behaviors
Prominent video integration
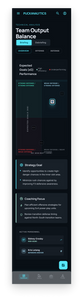
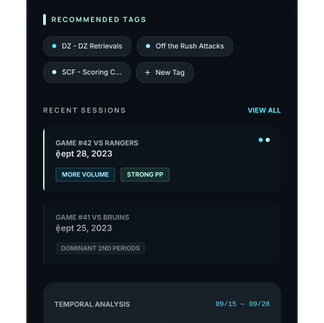
Modular dashboards for stats, comparisons, and AI-driven insights
AI Integration
Designed conversational AI features (AI Coach) for both platforms:
Mobile: Contextual stat explanations through a conversational layer. Early implementation focused on personal data only.
Web: Coaches could request comparisons, generate performance summaries, and explore trends across games, teams, and metrics. Outputs were always explainable, editable, and visually integrated.
UX/UI
Mid fidelity, High Fidelity
The assignment evolved from a successful revamp of the mobile app, along with a lean branding suite based on Gen AI tools, into a comprehensive redesign of the web platform that matched the new branding and mobile app UI.
Lean Branding / Gen AI


Mobile
The first iteration included an onboarding session, which allowed me to understand the importance and role of statistics for young players on the road, as well as a lean UX audit of the current platform.
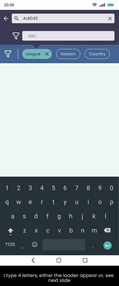
Low fidelity - Evolve search


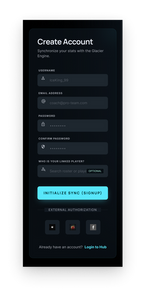
High fidelity - Dark mode (Following AI coach branding)


Initial Mobile Usability Testing
Conducted tests with real users (players) on Product day to validate navigation, comprehension of stats, and AI interactions.
Addressed feedback on terminology, stat explanations, and visual clarity.
“Dark mode helps, especially when you’re in a moving bus at night." Mobile tester during Product Day
Web Application
Before and After


Mid Fidelity


High Fidelity


To sum it up
Key Challenges and Trade-offs
Complexity vs. Simplicity: Balancing the depth of analytics with the need for clarity and ease of use, especially for younger players.
Consistency Across Platforms: Ensuring mobile and web experiences felt coherent, despite different user needs and contexts.
AI Explainability: Making sure AI-generated insights were trusted and understood, not just "black box" outputs.
Key Design Wins
Information Architecture Overhaul: Uncover hidden features and tailor the app to support the journeys, characteristics, and needs of all personas, catering to their diverse needs.
Personalized AI Coach: Tailored stat support for players and data-literate narratives for coaches.
Visual & Brand Consistency: GenAI-enhanced visuals and dark/light modes aligned with the team's evolving identity.
Video & Data Synergy: Jumping between metrics and relevant video clips became seamless.
User Feedback
Coaches reported that they found planning and post-game reviews easier.
Players expressed increased confidence and enjoyment when interpreting their own stats.
Mobile testing confirmed better navigation and comprehension under time constraints.
Impact
While full analytics were pending at handoff, qualitative results showed significant progress in:
Reducing friction in stat interpretation.
Aligning AI tools to user mental models.
Laying the groundwork for future AI-coach capabilities at scale.